Thursday, March 31, 2005

March 31, 2005: Chop

After close analysis:

Yes, I need to have a new pattern called "Chop"! Ugly day at best where everything was consolidating and taking a breather from yesterday's runnup. Nothing has changed except the successful bounce of key levels on AB and ES. Tomorrow should have a follow-through to the upside if the test of the lows were to hold, if not, watch out!

Market breadth was neutral. Vold, Add, and Addq were almost neutral with a positive uptick.

Futures chopped all day and difficult to trade. Those are the days where one wants to avoid committing size. AB, NQ, and ES were in positive territory but w/tight ranges.

Indices weren't any different from overall market whereby Semis are still forming continuation patterns and don't seem wanting to breakout yet. Dow - nothing to comment on!

Overall positive day!

Wednesday, March 30, 2005

March 30, 2005: TD

After close analysis:

Market made a statement today and held its ground with a nice reversal to the upside. It's clear that AB & ES levels I talked about last couple of days are worth something. Yesterday's fake break as I suspected resulted in a violent reaction to the upside, and that's why I don't like to play continuation on late day breaks in the following morning. So what do I do? Will watch for long setups as long as the 9-day ema is cleared to the upside. Ema zones are usually fraught with chop.

Observation(s) of the day: Add and Addq had what I call the "crocodile" pattern: the emas just have this creeping parallel straight line action with a slight +ve xover then all of a sudden diverge (open mouth)...spooky...

Market breadth was very strong to the upside, almost the opposite of yesterday! Vold recorded its best level in quite a while (@1000+). Add and Addq also opened and traded higher than previous day all day.

Futures were strong today, especially NQ which traded above its ema all day - been a while. AB had a nice range (finally!) with ES also showing a nice TD. AB didn't clear its previous b/o pt. while ES and NQ were able to consolidate and do so after some consolidation above these levels. ES200R is in +ve zone.

Indices established some bottoms. Semis have a clear triple bottom with multi-day H&S breached to the upside. Also, during the day, the consolidation rested on the ema then took off to the upside which is a good sign for the long side. Dow after yesterday's fake break yesterday had similar price action and cnsld/traded above recent multi-day ascending channel. Closest area to watch is the 10630-50 area for resistance.

Overall positive day!

Tuesday, March 29, 2005

March 29,2005: TD

After close analysis:

Wow! Talk about market imploding! As yesterday's action suggested, it was about time the market made a major move, and obviously it was to the downside. After a morning fake move to upside the market just imploded . This reminds me of 2001/o2 where every morning market would fake to upside then slide down for rest of day! Nothing different about this one. The multi-day pattern was breached to the downside on all indices and if there were any doubts about what direction the trades should be taken yesterday provided good reminder. So now there's retracement out of a breakout and also AB and ES areas mentioned yesterday are here. No early trades in the morning cuz of traps. So afternoon trading will be my plan for tomorrow.

Market breadth ended very weak for the first time in quite some time. Vold hit a low @930 which is quite strong and breached multi-day lows. Add and Addq same story with Addq having 4-feathers pattern. It takes extreme readings like this to get a bounce to the upside.

Futures broke out of their narrow ranges today in a big way especially AB (wow!) - talk about 1 direction! NQ, ES, and AB are all below their emas with NQ retracing out of a multi-day wedge. ES200R certainly in -ve territory.

Indices provided some interesting patterns: Sox/Smh formed a H&S as predicted and broke down a tad so will watch tomorrow. Dow same story with a clear ascending channel breaking down below ema.

Overall positive day!

Monday, March 28, 2005

March 28, 2005: Cnsld

After close analysis:

Wasn't feeling well so didn't trade. Same story: market bleeding to the downside with some chop and cnsld along the way. Should be noted that multi-day consolidation patterns are setting up and should have a break within next couple of days. 6bo is the only counter trend setup, other than that it's "shorts". ES's 1160 area and AB's 605 are the levels to watch for possible support.

Thought(s) of the day: Don't know why would one think that market will reverse all of a sudden and in the process discounting the fact that NQ spent 2 months in distribution and finally broke to the downside out of a dbl. hump ala 2000! Regarding currencies, paper account is up by 200ticks on 1 contract so far. The 4 hr. charts are worth following and it seems that position trades are something to consider vs. intra-day trading.

Market breadth spent all day in nr at lower levels that previous days. Nothing to talk about other than the 4-feathers pattern on Addq which provided a nice confirmation to a short trade on AB. Vold, Add, and Addq still in -ve xover.

Futures didn't do much today with NR all over the place. AB has been in a tight range for last couple of weeks (what's up w/that?!). AB found resistance at ema (as usual) and had a triangle break late in the morning. NQ and ES spent some time above their emas only to reverse by end of day. ES200R hovered above ema as well, but now in bearish territory. It's clear that YM and NQ have a multi-day pattern which will break (most likely to downside).

Indices tried to make something out of a fake move in the morning above a multi-day triangle with a clear dbl. bottom (Sox/Smh). Dow has formed a clear megaphone consolidation pattern and will be watched for a break.

Overall positive day!

Thursday, March 24, 2005

March 24, 2005: Gartley's M

After close analysis:

After a move up till approx. 1pm, the market consolidated and reversed to the downside for the rest of the day. I recognize that this was how 2001 and 2002 used to be - just persistent downmoves with no signs of stopping. The break of dbl. hump on NQ isn't something to be underestimated especially following few months of going nowhere (aka cnsld). Daytrading wise, it's still very good with clear moves in both directions. Same plan as yesterday, keep watching the b/o pattern on semis, 1160 area on ES, and AB's 605. I'm anticipating a dip early next week then a bounce up if the H&S pattern were to play out.

Observation(s) of the day: the 4-bar descending pattern (might call it 4 feathers pattern) on Addq provided excellent confirmation for a short trade (6 bar b/o).

Market breadth formed an M pattern today. Add and Addq opened higher than previous couple of days but reversed course towards end of day. Vold was +ve but nothing to talk about in terms of strength which is typical PA on a cnsld day. All 3 closed with -ve xover.

Futures tried a mini rally in the morning and met ema resistance. On the charts it's clear that there're multi-day consolidation patterns taking place at the moment signaling the next major move. AB rallied to it's ema (within ema zone) and just reversed back below that zone. NQ and ES rallied above their emas, consolidated, then broke down below it. ES200R still in bearish zone.

Indices might be the story of the day with their multi-day cnsld pattern. Smh/Sox rallied above their emas only to hit resistance at neckline. This might turn out to be the deciding factor on where the market will be going for at least the short-term. Dow was in multi-day ascending channel pattern and finally broke down before the close.

Overall positive day!

Wednesday, March 23, 2005

March 23, 2005: Wedge

After close analysis:

This is day following FOMC, and usually market rallies in either direction 1 or 2 days following such event. Well, today was all about consolidation and again was also about "patterns"! It's very clear on the charts that most if not all indices and futs experienced either triangles or wedges: they're b/o patterns but in this case are considered continuation after yesterday's spike down. Market is weak and bottom pickers must be all over the place. Only thing I see supporting some kind of consolidation or reversal to upside is the pattern on Semis whereby a triangle is forming w/clear dbl. bottom. Another thing I'll be following is the 1160 area on ES which is key. Other than that, I go with what the system says: short.

Observation(s) of the day: yesterday's b/o point in the afternoon was the resistance level for today. It's not the highs and lows - it's all about the b/o's (maybe I should coin that? :P).
I always have all sessions charts up to see where price is closest to emas.

Market breadth was weak for the day with Add and Addq just consolidating at bottom of yesterday's range. Vold didn't make a new low today but was very weak (low @ -500) considering it was a consolidation day.

Futures consolidated all day in a wedge pattern before breaking out of it late in the day. Also all couldn't take out 2 important things: Ema and yesterday's b/o point. This can be seen on NQ and ES200R's chinese great wall. AB same price action with 605 just few points away. ES close to 1160 and will keep a close eye on that area for a possible support and bounce.

Indices tried to rally in the morning but bumped against emas and turned back later in the day. Semis seem to be forming a b/o pattern to either side and will keep watching it. Dow was the weakest of them all and didn't even approach its prior day's b/o point.

Overall positive day!

Tuesday, March 22, 2005

March 22, 2005: Ledge on FOMC

After close analysis:

I stopped by room - it's been a while. Today was FOMC (raised rates by .25 as expected with worries about inflation) and boy what a day it was: Market bounced from oversold condition and also the breadth div over last couple of sessions. After FOMC announcement it just took a nosedive in 1 direction like falling off a ledge. There's no doubt that the market is in serious correction mode which kinda reminds me of 2001/02 with the scary double hump on NQ. What will I be watching for tomorrow? It's gotta be the 1160 and 605 levels on ES and AB respectively. There were couple of 6 bar b/o setups.

Observation(s) of the day: NQ gave nice clue again and signaled that morning's upmove was just a fake! (how many times did I see that).

Market breadth was +ve prior to FOMC announcement but tanked big time after the announcement. Vold, Add, and Addq are all with -ve xover.

Futures bounced in the morning. AB b/o'd its ema on a 6 bar b/o prior to FOMC but couldn't hold and broke down. Interestingly its 1st cnsld was below the emas which was a good spot to reshort and play continuation trade. NQ gave a nice clue that morning move was probably a fake, cuz it was weak all day and couldn't rally past yesterday's range and bumped against its ema. ES200R setup a nice ascending channel prior to FOMC which confirmed short setup after breaching its ema. ES, AB, and NQ are under their emas.

Indices same like futs and market breadth. Sox was stronger than Smh and bounced off its channel, but both bumped against their emas and fell like rest of market later on. Dow tried to b/o of a triangle but was below its ema and kinda hint it that morning upmove wasn't genuine.

Overall positive day!

Monday, March 21, 2005

March 21, 2005: Cnsld

After close analysis:

More chop with tight ranges before tomorrow's FOMC. Nothing exciting in terms of setups or market action. Basically, everything is in bearish mode but w/very erratic PA. Only shorts at this stage and only counter trade would be a 6-bar b/o. I'm keeping an eye on breadth & semis tomorrow.

Market breadth was mixed. It's obvious that Add and Addq acted differently today with Add being the weaker of the 2. It's also that while futs made newer lows the Addq held and looked bullish. Something to watch for next couple of days. Vold was -ve but not too weak signaling any kind of blowoff action. Just a steady bleed to the downside.

Futures stayed below their emas w/no exceptions. Had a bunch of triangle patterns with weak b/o late in the day. Not much there cuz the emas are like the 'great wall of China': the ES200R is a great example. AB continues to trade within tight ranges, so is NQ and ES. All are still below their emas.

Indices consolidated during the day. It's worth noting that the descending channel on Sox was broken to the upside and the afternoon pullback was on the upper channel TL. Nevertheless, Sox/Smh and the Dow all remain below their emas.

Overall neutral day!

Sunday, March 20, 2005

Weekly Rehab!

Haven't been feeling too well last 2 weeks. Got a nice injection on Friday from my trading support system...was really moved just knowing some do care about me and it's not just about trading...I do feel lonely... I think I'll just take a break for few days...

Ok, onto something meaningful...patterns and 'PA' observations:


7-bar hi b/o in the afternoon
----------------------------------


downward consolidation (bleed) for 4 30-min bars usually results in a good short setup
----------------------------------


BEFORE: look at bars with descending highs while lows holding


AFTER: probability is in favor of shorting since it's below ema
----------------------------------


BEFORE: bars with descending highs looking like a waterfall


AFTER: wait for 3-4 bars while pattern is forming, this should result in a 'spike' down.
---------------------------------


BEFORE: looks meaningless but....


AFTER: ...with plotting some lines it does look like a consolidation within a triangle below ema - short

Friday, March 18, 2005

March 18, 2005: CNSLD

After close analysis:

This is Opex and usually means chop (no trading today). Well, market got some of that in afternoon after breaking down earlier. I was expecting market to hold but it didn't. This doesn't mean that I expect more down on Monday. As a matter of fact, I still think we'll have a healthy bounce to the upside next week... we'll see. Should be noted that Vold didn't have a huge down volume which makes me think we're due for a bounce to the upside. Will ignore Dow and AB in terms of TA, but will keep an eye on Semis, NQ, and ES for clues.

Observation(s) of the day: Today was a day of patterns. So many intraday patterns should've provided excellent clues for 'PA' and setups. Very important to understand and track what these patterns look like and mean in terms of giving an edge for next move.

Market breadth was -ve from the get go. Vold, Add, and Addq all opened below previous day's range. The 7-bar hi/low study on Vold still shows nice b/o levels. Addq/Add also showed a nice 2/4-bar breakdown: excellent confirmation for a short setup. All 3 are about to have +ve xover.

Futures consolidated in morning before breaking down in afternoon then experiencing a late day reversal to the upside. NQ broke down from a multi-day horizontal channel then reverted to some chop till end of day. ES formed a triangle in the morning before breaking down as well. As for AB, it formed a triangle with "selling pressure" all over it before breaking down. The afternoon reversal up was met with ema resistance. AB's range wasn't that great and still choppy, but it's Opex so that was kinda expected. ES200R amazing chart shows price bumping against ema resistance - still bearish.

Indices were mixed today: Semis consolidated all day after an early morning spike down. Sox/Smh are trading in a descending channel which means a break to the upside can be expected. Dow on the other hand had 2 interesting patterns: first, one is the 3-day horizontal channel which was taken out to the downside. Second, there was a 'waterfall' pattern that took place all morning which formed on the bottom of the horizontal channel and eventually offered a short based on breakdown. These are very important patterns to watch for intraday trading.

Overall neutral day!

Thursday, March 17, 2005

March 17, 2005: M

After close analysis:

Wasn't feeling well so took the day off. The consolidation day was expected and from what I see it didn't offer that much other than a soft bounce to the upside, but still the emas and levels are offering strong resistance. I do expect another cnsld day tomorrow and w/Opex it should be a tricky day to trade (I'm also not trading tomorrow for that reason).

Market breadth was mixed with Vold ticking up all day but not much to the upside, while Add and Addq opened higher than previous day but consolidate for the rest of it.

Futures formed an M pattern all day with tight ranges. Ab, NQ, and ES worked in same direction and still below their emas. ES200R chart is still below the ema (bearish zone).

Indices consolidated all day. Some might interpret this as -ve cuz the cnsld is at bottom of range. I do think we might hold here at least for a day or two. Sox/Smh and Dow all below their emas.

Overall neutral day!

Wednesday, March 16, 2005

March 16, 2005: TD

After close analysis:

My, oh my! Did the market break down or what?! It was kinda expected based on yesterday's pattern and also daily.. Dow's waterfall was a giveaway for that matter and today the 10630-50 area proved its worth. Took the 6bo and a late day scalp for a minor loss (dunno why I even thought about it!). I do expect a bounce tomorrow and will have to pick my spots. It should be an easier day if it turns out to be another TD down.

Observations(s) of the day: 2 bar break on Addq gives a very good confirmation for entries.

Thought(s) of the day: Yesterday, I was thinking seriously about trading NQ as well for next few weeks. Its range is terrible but it's as smooth as silk.

Market breadth opened lower than prior day (and this is when I knew market was gonna be in trouble) whereby Vold trended down for most of the day. Add and Addq kept floating around before consolidating around noon then breaking down in the afternoon. All 3 still have -ve xover.

Futures were clearly down with NQ & ES being the stars of the day: NQ broke down from a multi-month consolidation and this ain't good for the bulls (what bulls!). Also Es had a massive multi-day H&S which broke to the downside. AB didn't do much and had a narrower range than the others. All clearly below their emas. ES200R amazing chart is clearly bearish.

Indices didn't do any better. The Dow just got clobbered (omg!) with SMH/SOX continuing to bleed! It's obvious when early morning strength is sold into the day ain't gonna be fun trading from the long side.

Overall positive day!

Tuesday, March 15, 2005

March 15, 2005: TD

After close analysis:

Yep, the gap up open was a fake and market continued to bleed to the downside all day. NQ getting scary with the dbl. hump (ala 2000?)... Nice couple of shorts especially the 6bo. Market setting up for a major move tomorrow. I'll be keeping a close eye on NQ, this will be key.

Market breadth was negative all the way with Vold, Add, and Addq trending down. All 3 have -ve xover.

Futures also were weak with NQ opening below its ema. AB spent morning above emas but soon consolidated and broke below it. This was an excellent entry point for a short (spot marked by a circle) which was confirmed by Addq. ES also had a TD and broke down below its ema. ES200R amazing chart is bearish.

Indices trended lower with SMH/SOX breaking down and cnsld for most of the day. Dow broke down and I'm looking @10630-50 area for possible support.

Overall positive day!

Monday, March 14, 2005

March 14, 2005: Thiesta

After close analysis:

This was an easy day to trade. Traded short side then recognized Thiesta pattern and went long. Considering the tight range, it was an excellent day! I don't buy into late day reversals like this one (they call it 'technical bounce'? who knows!). Market has to show me follow-thru tomorrow morning otherwise I'll be taking the short side. Ok, so I'm playing around w/posting some thumbnails... lemme see if this looks nice...

Observation(s) of the day: Mini-Thiesta pattern on Addq and Add confirmed by Semis.

Market breadth opened higher than previous day and after some morning cnsld b/o, Addq and Add based and reversed to the upside. Vold was much stronger as well for most of the day. All 3 closed w/+ve xover.

Futures consolidated in the morning and broke down of triangles or channels, then based and reversed to the upside. AB had a beautiful triangle b/o then reversed to the upside and is bumping against the 9day-ema in addition to multi-day apex which is strong resistance! NQ was much stronger today and looked like a dbl bottom. Amazing ES200R along w/other futs are at their emas.

Indices were a good clue for a reversal today since SMH/SOX had a triangle but didn't breakdown. Dow had a mini Thiesta as well and is below its ema.

Overall positive day!


Mini_Thiesta (repeating pattern): triangle b/o, base, reverse

Friday, March 11, 2005

March 11, 2005: TD

After close analysis:

Trend day with plenty of resistance at emas in the morning before breaking down for the rest of the day.

Market breadth opened higher than previous day but soon broke down later in the afternoon after some consolidation.

Futures spent all day below their emas. AB, NQ, ES.

Indices were negative as well. Sox/Smh broke down from a multi-day wedge pattern and spent rest of day below their emas.

Overall neutral day!

Thursday, March 10, 2005

March 10, 2005: W

After close analysis:

Markets continued to hold below 9-day ema so the short side now is in play.

Market breadth opened higher than previous day, Addq, Add, Vold found support at b/o levels and reversed/cnsld, only to resume downtrend.

Futures weren't in sync w/market breadth: opened much lower, and that explains the mid-day violent reversal. AB opened and retraced back to Triangle apex twice only to find resistance. This is important! There was "stair" or "4-feathers" pattern which usually resolves into an arc!

Indices broke out of multi-day TLs and semis were stronger all day forming what could possibly be a multi-day double bottom.

Overall neutral day!

Wednesday, March 09, 2005

March 9, 2005: M day

After close analysis:

Market opened below 9-day ema and stayed there all day. This implies change in trend at least for intraday trading.

Market breadth was negative all day and much lower than previous day. Vold, Add, and Addq.

Futures spent day below emas. AB formed triangle most of the day (blow 9-day ema) until it broke down later in the day. All others were below their emas including ES200R chart.

Indices spent the day consolidating below their respective emas.

Overall neutral day!

Tuesday, March 08, 2005

March 8, 2005: mini TD

After close analysis:
Market trended lower all day and closed day on top of 9-day ema. Key decision tomorrow.

Market breadth was decidedly negative.

Futures spent day downtrending but ended day resting on key emas.

Indices were negative as well and semis breached their emas in addition to multi-day channel lower trendline.

Overall neutral day!

Monday, March 07, 2005

March 7, 2005

After close analysis:

Market breadth was lower than Friday. Vold, Addq, and Add with Addq breaking down from a 2-day triangle.

Futures peaked around noon time and then reversed course for rest of day. ES, AB, NQ.

Indices mirrored futs with semis reversing off multi-day channel lower trendline. Dow reversed before reaching 11k!

Overall neutral day!

Saturday, March 05, 2005

Weekly Rehab!

Ok, I've looked over some charts trying to gauge fundamentals. Yep, so many things conspiring against a healthy recovery in the intermediate and long term:

Oil is up again and looks like rallying w/possible arc/blowoff top!
Commdities Up: Grains like Soybeans (they make sauce out of this?)... inflation implication!
Dollah forming flag on daily and below its ema on weekly(down).
Euro and Gold opposite of dollah and looking for a blowoff/arc (Up).
Bonds and notes don't look too hot at all and remind of the double hump on Naz back in 2000! Not pretty at all once these yields start going up. Implication? Housing market bubble will burst!
Add to that Naz & Semis divergence with Dow and S&P...meaning that at the moment cyclicals are best game in town, and what happens once those take center stage? Not bullish for sure...

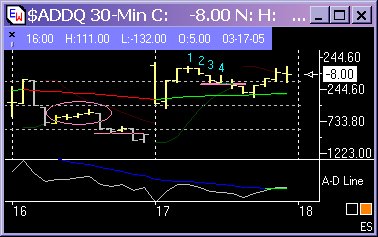
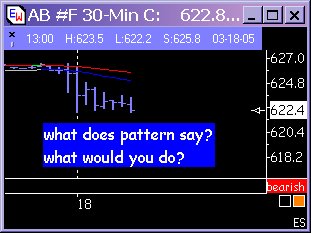
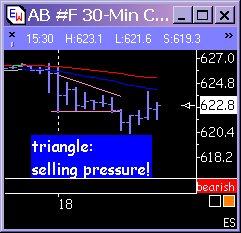
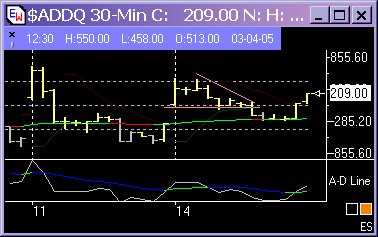
Some research findings for intraday trading:
4-bar b/o is as good as 6 b/o on AB?? Setup has to point to a 6bar b/o?? (e.g. not 4 bars making higher highs/lows)...some work to do here! The 2bar b/o on Addq is v. reliable so is the 4bar b/o. The 90m range is something I'd like to track for a while, but looks worthwhile. 
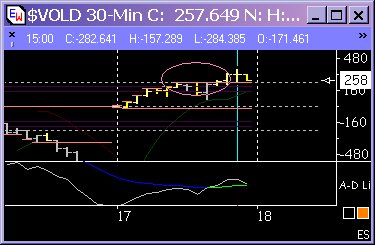
7bar hi/low on Vold is just a function of how the market works. Assumption is by lunch volume will eventually tapper off, so the hi/low of first 7bars need to be watched for continuation. Also on Vold, the threshold of +-150-200 seems to be the b/o level. Any b/o out of this threshold seems to indicate strength and vice versa: if Vold is contained within these boundaries then look for consolidation.

I'm still working on 1br exits. I also like Jil's idea that stop needs to be moved equal to move in favor of trade e.g. if price moves up 7ticks then stop should be moved up by 7ticks and so forth.....

Decided to trade the Euro, and last 2 weeks I kicked off a new journey. For next 6 months I'll focus on researching it before making any live trades. Have no doubt the keys to trading it will be found. If there's something that has developed from this relative short journey, it had to be patience.
-----------------------------------------------------------------------------------------------
Ok, on w/some weekend blah (boredom?):
Account drawdowns, ay yay yay... very delicate topic... bottom line is my view over the years has changed regarding this. Nu me says that a drawdown should be viewed as a healthy account pullback - I don't mind it as long as it doesn't develop into a pattern and that it's not steep. Case closed I guess?

More late morning blah:
Why keep sticking to what I know? So many methods but I only choose the ones that suit my own way of thinking and that complement each other. Gann, fibs come to mind as a great combination. Ditto Emas and market breadth. FL is about only thing that comes close to AB system and I leave it to dbq and J to lemme know if it's confirming it. Also learned not to listen to anyone but observe if it makes sense to me first. One of the keys to market mastery is understanding how things work well "together". Resisting the temptation of other methods gets easier. My belief is unchanged: Unison is the way to go!

Ok, till next rehab......
Quote from John47:

I wasn't thinking of that woodies type BS...or whatever...

Ahhhh woodie's chatroom...good old memories...

Woodie: Yup, thats a CCI signal...look at it go.
Fan: Woodie, the market just reversed on us. >_<
Woodie: Erm...I got out with a 2 tick profit before the reversal!
Fan: T_T

Woodie: Look, another signal!
Fan: Woodie, what did I do wrong, the market reversed again.
Woodie: Remove all indicators, just use the CCI...see I got out with 1 tick profit before it reversed!
Fan: T_T

Fan: Thats a signal Woodie.
Woodie:
Fan: Thats a signal Woodie.
Woodie:
Fan: WOODIE!!! THATS A SIGNAL!!
Woodie:
*Market goes in favor of the signal*
Woodie: Yep, that was a signal back there, I'm already in.
Fan: T_T

Fan: I missed 1 signal and cut losses on 2 so far.
Woodie: I declare 3 winners out of 3 today for Woodie's CCI!!!
Fan: T_T

Friday, March 04, 2005

March 4, 2005: Crane

After close analysis:

Well well well! Ok, so some employement kaka came out then the market has a whimpy rally! That's all we got today. Of course didn't trade cuz it's Friday, but nice thing I recognized pattern early in the day! yea yea yea.... Well, most important thing is 10875 on dowg was taken out (holly ....) and path of least resistance is up at least for this index and SP. Rally wasn't spectacular but we'll have to wait and see what the overall market will look like next few weeks.

Observation(s) of the day: Nazdog and semis aren't participating in all of this! (alarming)... might need to revise my dow projections based on that.

Market breadth was mixed. Vold and Add which mostly track Dow and ES were relatively stronger than Addq which correlates with NQ and AB.

Futures were mixed as well. Everything moved together except NQ! AB had nice crane pattern with morning out of a descending channel. Pattern on 3 and 30m showing clear arc in the making and that's what happened! ES200R amazing chart remains in bullish area.

Indices were mixed as well. Naz the laggard with nothing to show for. Semis same story but sitting on bottom of multi-day channel... This is troublesome. Dow on the other hand just rallied out of channel and gapped up in morning above 10875 and marching towards 11k!!

Overall neutral day!

Thursday, March 03, 2005

March 3, 2005: "V"

After close analysis:

Market indecisive at this stage. Geez! As if everything in this market is hinging on the employment number tomorrow - this is bordering on sillyness (let the children play!). Nice 6bo off a 2bo around ema in the afternoon. It's obvious the market is making a flag on the daily, so either we go thru 10875 or this is gonna be the top for a very long while. Can't complain: this continues to be a traders' market.

Observation(s) of the day: the semis and nq are still diverging from overall market. Also clear triangle forming on NQ and possible double hump on AB daily- will post in weekly rehab. Today, the market was clearly manipulated and held for tomorrow's number.

Market breadth opened higher than previous day but broke down in the morning only to make a U-turn in the afternoon. I'm watching the 7-bar range on Vold, as it's tight and due for a b/o tomorrow. Add and Addq been yoyoing for few days with more flips than one can count 1-3 (:P).

Futures tanked in the morning and retraced most of the loss by afternoon forming lower highs. AB reversed off it's ema (no wow here, been doing this forever). NQ is the weakest and remains below its ema. ES200R amazing chart broke wedge and formed horizontal channel (pattern can be found on others too) and now in bullish zone.

Indices were mixed. SOX/SMH gave early warning in the morning of a pending breakdown in the market-broke their multi-day wedges and retraced to b/o point in the afternoon but still below emas. Dowg (ahaha) is above its ema (I'm sure it's giving many a heartattack cuz it's flirting with that 10875 level), broke wedge but soon ran up above its ema and now 40 pts. away from that b/o level.

Overall positive day!

Wednesday, March 02, 2005

March 2, 2005: Inverted U-turn

After close analysis:

Today was jail confinement for me (hehe), so didn't trade. Ok, so added more colors and ranges to charts (better than nothing!). This was an important day as it did confirm beyond any shadow of doubt that 10875 is "the" level on the Dow! Market reversed after stopping short from hitting this level (wow!) after a morning rally that signaled a TD but with weaker breadth there was something wrong with this picture! Interesting to see tomorrow if we get continuation down. If so, then any morning break below today's lows might be a bear trap, so waiting till afternoon is the best thing I can do-leaning towards shorting though. Finally, nice 6bo setup on reversal.

Observation(s) of the day: the 4 bar cnsld on AB sure looked heavy which looked exactly like Feb. 23 & 15th (and Jan. 27 as my gurl pointed out) - market reversed course. Also, the divergence (the what?!) between breadth and upmove on futs was a warning sign.

Thought(s) of the day: if there's something that's gonna bring down the housing bubble it's the pattern of 10Y notes and 30Y bonds! Oh man, reminds me of Oct. 2000! More on that in weekly rehab. Grains rallying?? Oh no!

Market breadth opened lower than previous day and couldn't take out yesterday's bo range. Addq, Add, and Vold hit resistance and reversed. -ve xover on all!

Futures rallied in morning but then had a bear cnsld pattern and reversed to the downside forming U-turn ("House") pattern. AB, NQ, and ES all reversed and their butts are well-rested on emas (hehe). With -ve xover on breadth, shorts will be setting up. ES200R amazing chart is still in bullish zone but has multi-day wedge. To watch for tomorrow!

Indices were highlighted by 2 important things: Dow's 10875 level (bull/bear per my analysis!) and SMH/SOX's multi-day wedge that was slighly breached before the close. Not good for the bulls for sure!

Overall neutral day!

Tuesday, March 01, 2005

March 1, 2005: NR

After close analysis:

Omg! Where should I start?? This was one of the strangest days I've encountered in a long while. Chaos, technical difficulties, cable went down, call broker: answer God da** it, place hard stop, check my online account, override stop, esignal down, ensign crashed, nice hit on the trade, what in the world is goin' on??? Did I say, I broke my rules as well, oh yea I DID! Back to market. This was an NR day with fakes and twists that could dry up an account in one day (Can't believe I barely survived it!!, and the support in room was unbelievable!) . Based on today's action, market might be setting up for a TD tomorrow. Too tired and lacked discipline so tomorrow is off for me.

Market breadth
was thin as a razor, and I'm talking Add and Addq: both opened much higher than previous day and stayed up. Vold kept creeping higher but w/no conviction, hi for day @572.

Futures were in a very tight range all day. AB wasn't too enthusiastic about participating although it started turning up towards end of day after bouncing off its ema few times. It did b/o out of the morning triangle only for price to return to apex! ES and NQ both stayed above their emas and used them as a crutch, with NQ having a nice movement to the upside. ES200R amazing chart is in bullish zone and had a channel break, let's see if it continues.

Indices ran in the morning, pulled back in afternoon then tried to rally late in the day. SMH & SOX are about to have a major b/o out of a wedge, this is to watch. Dow also stayed in upper range for the day and is about 40 pts. away from breaking 10875 level! Watch out for that!

Overall positive day!