March 24, 2006: 'N' day
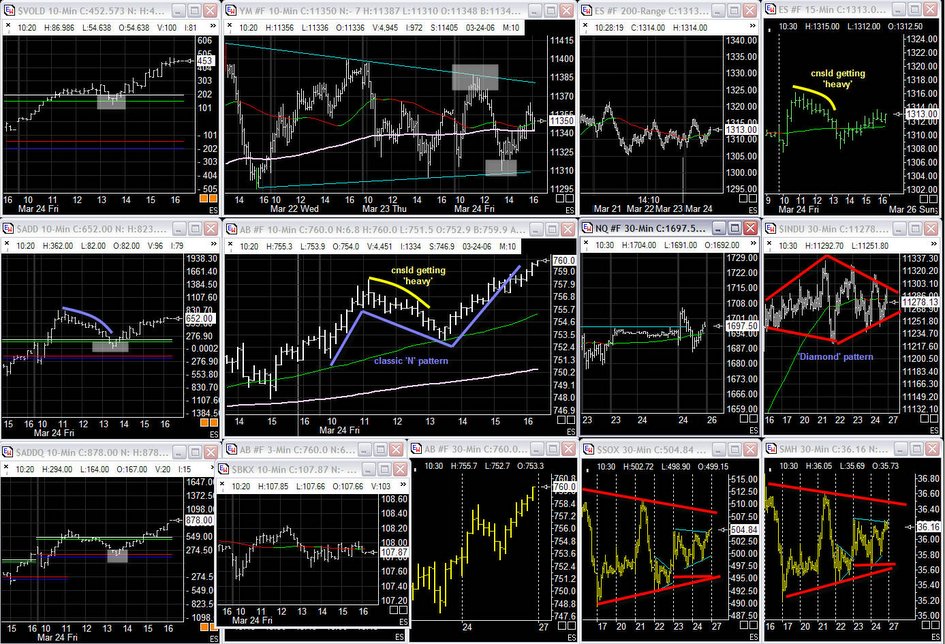 Classic 'N' day as shown on AB chart so did other indices. Note the heavy cnsld (highlighted by an arc) not to be mistaken w/bullish cnsld. The worst a bullish cnsld can do is hold its ground and trade sideways, but if it gets heavier and heavier like trickling to the downside then it is most likely followed by a blowoff to the downside.
Interesting diamond pattern on the Dow and I believe a break out of it will decide whether it makes a new all-time high or this is the top!!
The semis cnsld sideways as highlighted in previous session's blog and today it tested the first triangle pivot successfully. Now there's a multi-day wedge forming as highlighted in red. Either the W is completed to the upside or is broken to the downside. Either way the semis will either support the market's breakout to new highs or this is the TOP for a long while.
Speaking of wedges there's also one on the YM and that trapped today's movement in the market.

posted by Pam at 9:21 PM
![]()


1 Comments:
Glad to see you back in action! Keep it up! -dbq
Post a Comment
<< Home