Weekend Ramblings
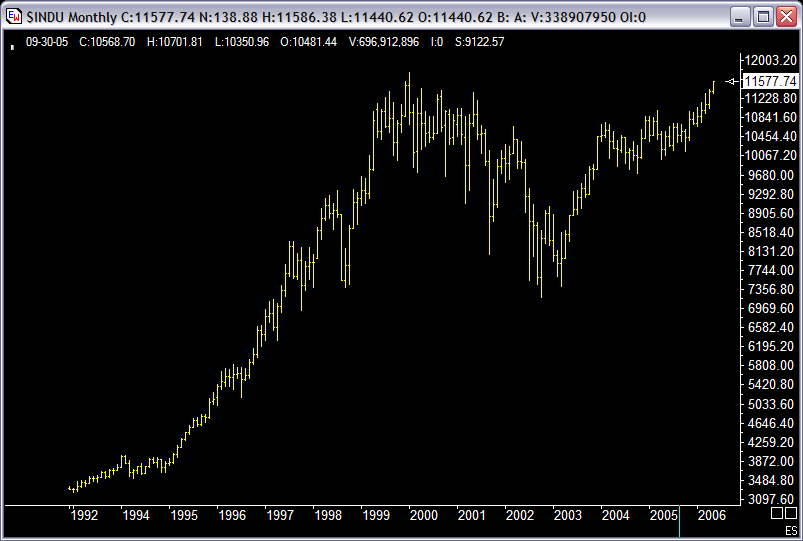
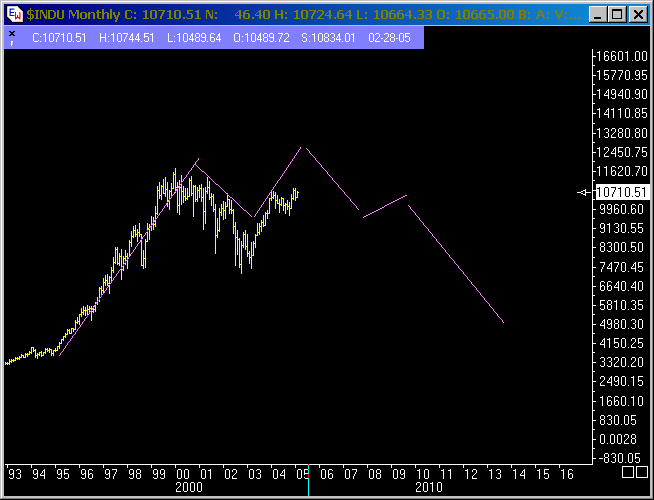 There're some things that I need to point out such as the Dow approaching an all-time high.. This has been a prediction I've stuck to for the last couple of years (see chart posted in early 2005 on the left compared to where we're right now on the right). Monthly patterns show the pattern pretty well and how it would unfold... Some will think this is the reborn of the bull market and I beg to differ based on similar historical patterns... If we reach a new all-time hi it'll be the ultimate hi in a very looong time, even beyond my generation's time! I'd like to stay away from doom and gloom predictions but quite frankly the patterns and charts have been sending loud signals about having a major meltdown globally akin to the depression of the late 1920s and I have to trust my instincts at this point!!
Let's look at where are we now...the Dow is surely forming an arc as seen on the weekly. So far the Dow is following the script. Where does the Dow top? I don't know! It's uncharted territory and fibs clusters might be the only tool to project. But here's a prediction: This coming fall in terms of time cycle might be where the top is found.
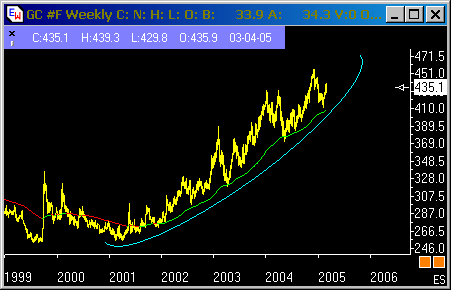

Gold and Oil are following the historical scripts and clearly show the power of arcs. This are classic charts that I'll be referring to all the time for learning. I'm posting the monthly chart dating to early 2005 and where we are right now. Doesn't the weekly chart on gold indicate a top on Gold for the time being? It sure does.
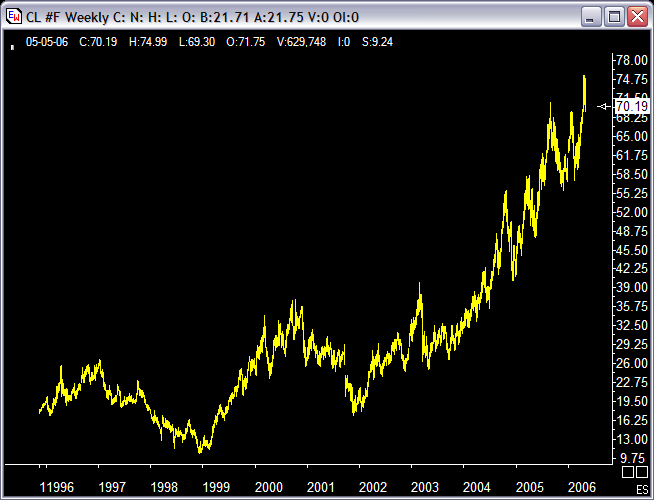
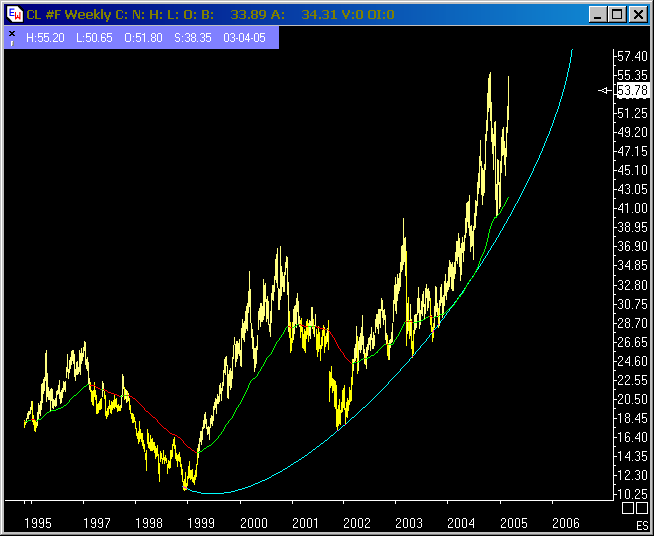
How about oil? It's the same story, back in 2005 the arc surely predicted more upside on oil. The chart looks toppy too and there might be one more upswing but that should do it in terms of upward momentum for a while.
posted by Pam at 3:29 AM
![]()


0 Comments:
Post a Comment
<< Home